
PyTrendy is a robust solution for identifying and analyzing trends in time series. Unlike other trend detection packages, it is robust to noisy & flat segments, and handles for gradual & abrupt trend cases with a high precision. It aims to be the best package for trend detection in python.


Install the package from PyPi.
pip install pytrendy
Import pytrendy.
import pytrendy as ptLoad daily time series data. In this case, we're using one of pytrendy's custom examples.
df = pt.load_data('series_synthetic')
print(df)

#             date     abrupt    gradual  gradual-noisy-20
#  0    2025-01-01  19.578066  12.500000         27.514106
#  1    2025-01-02  19.358378  13.421717         -6.620099
#  2    2025-01-03  19.228408  13.474026         22.122134
#  3    2025-01-04  19.727130  13.474026         13.863735
#  4    2025-01-05  20.773716  14.505772          8.884535
#  ..          ...        ...        ...               ...
#  176  2025-06-26   4.718725  20.616883         19.790026
#  177  2025-06-27   4.242065  20.978084         19.181404
#  178  2025-06-28   6.012296  22.449495         -6.563936
#  179  2025-06-29   4.603068  23.486652         48.291088
#  180  2025-06-30   4.435105  22.240260          3.343233
Run trend detection & plot the results.
results = pt.detect_trends(df, date_col='date', value_col='gradual', plot=True)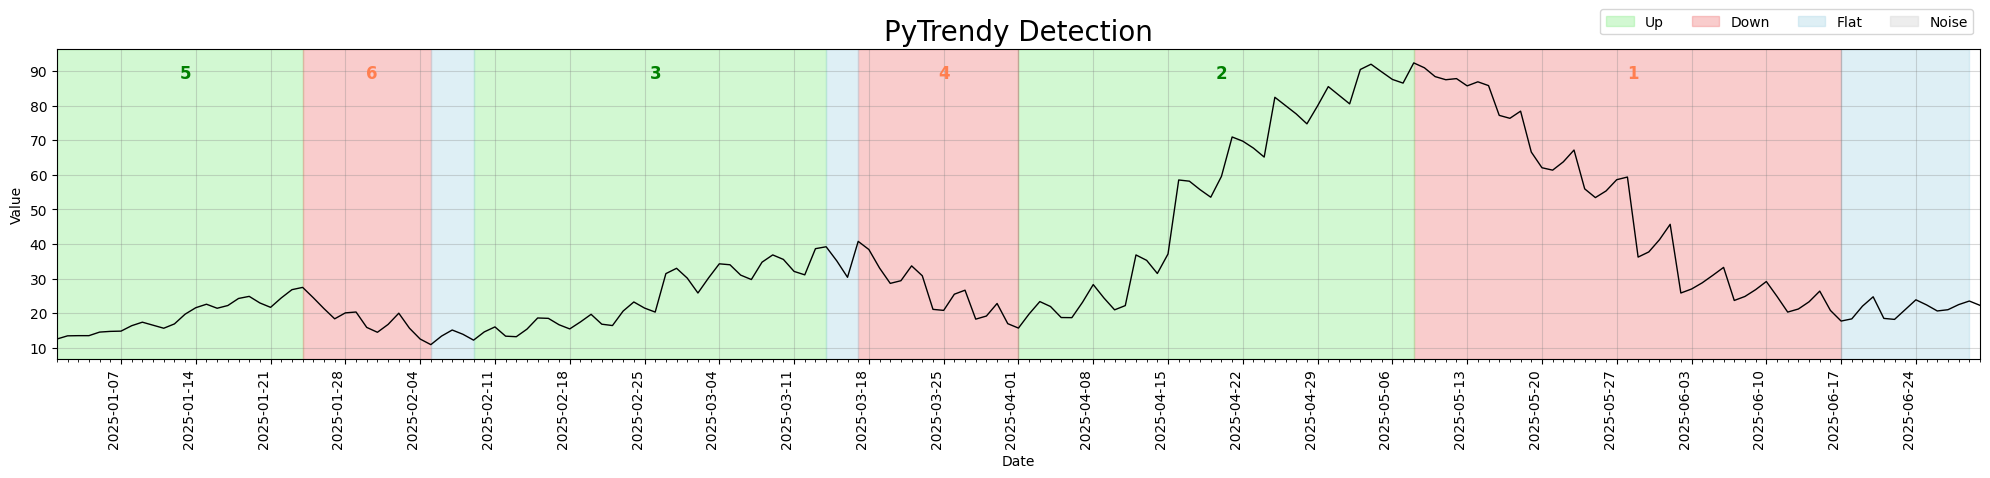
The results object can be used to summarise, further analyse, and generally inspect the trend detections.
results.print_summary()

#  Detected:
#  - 3 Uptrends.
#  - 3 Downtrends.
#  - 3 Flats.
#  - 0 Noise.

#  The best detected trend is Down between dates 2025-05-09 - 2025-06-17

#  Full Results:
#  -------------------------------------------------------------------------------
#              direction       start         end  days  total_change  change_rank
#  time_index
#  1                 Up  2025-01-02  2025-01-24    22     14.013348            5
#  2               Down  2025-01-25  2025-02-05    11    -13.564214            6
#  3               Flat  2025-02-06  2025-02-09     3           NaN            7
#  4                 Up  2025-02-10  2025-03-14    32     24.632035            3
#  5               Flat  2025-03-15  2025-03-17     2           NaN            8
#  6               Down  2025-03-18  2025-04-01    14    -22.721861            4
#  7                 Up  2025-04-02  2025-05-08    36     72.611833            2
#  8               Down  2025-05-09  2025-06-17    39    -73.253968            1
#  9               Flat  2025-06-18  2025-06-30    12           NaN            9
#  -------------------------------------------------------------------------------
You can directly call the object as a pandas dataframe. Note change_rank which prioritises long duration and high magnitude of change.
results.df| time_index | direction | start | end | trend_class | change | pct_change | days | total_change | SNR | change_rank |
|---|---|---|---|---|---|---|---|---|---|---|
| 1 | Up | 2025-01-02 | 2025-01-24 | gradual | 14.013348 | 1.044080 | 22 | 14.013348 | 22.207980 | 5 |
| 2 | Down | 2025-01-25 | 2025-02-05 | gradual | -13.564214 | -0.554982 | 11 | -13.564214 | 17.360657 | 6 |
| 3 | Flat | 2025-02-06 | 2025-02-09 | NaN | NaN | NaN | 3 | NaN | 20.126008 | 7 |
| 4 | Up | 2025-02-10 | 2025-03-14 | gradual | 26.015512 | 1.974942 | 32 | 24.632035 | 18.871430 | 3 |
| 5 | Flat | 2025-03-15 | 2025-03-17 | NaN | NaN | NaN | 2 | NaN | 17.350339 | 8 |
| 6 | Down | 2025-03-18 | 2025-04-01 | gradual | -22.721861 | -0.591909 | 14 | -22.721861 | 16.762790 | 4 |
| 7 | Up | 2025-04-02 | 2025-05-08 | gradual | 73.687771 | 3.944243 | 36 | 72.611833 | 21.701162 | 2 |
| 8 | Down | 2025-05-09 | 2025-06-17 | gradual | -73.253968 | -0.805442 | 39 | -73.253968 | 21.122099 | 1 |
| 9 | Flat | 2025-06-18 | 2025-06-30 | NaN | NaN | NaN | 12 | NaN | 19.418124 | 9 |
- Full documentation with all features [WIP].
- Automated testing in CI/CD pipeline with full code coverage.
- Even more robust edge case testing & generalising.
- Customising more options for windows.