![]()


![]()
SOLWEIG-GPU is a Python package and command-line interface for running the standalone SOLWEIG (Solar and LongWave Environmental Irradiance Geometry) model on CPU or GPU (if available). It enables high-resolution urban microclimate modeling by computing key variables such as Sky View Factor (SVF), Mean Radiant Temperature (Tmrt), and the Universal Thermal Climate Index (UTCI).
SOLWEIG was originally developed by Dr. Fredrik Lindberg's group. Journal reference: Lindberg, F., Holmer, B. & Thorsson, S. SOLWEIG 1.0 – Modelling spatial variations of 3D radiant fluxes and mean radiant temperature in complex urban settings. Int J Biometeorol 52, 697–713 (2008). https://doi.org/10.1007/s00484-008-0162-7
SOLWEIG GPU code is an extension of the original SOLWEIG Python model that is part of the Urban Multi-scale Environmental Predictor (UMEP). GitHub code: https://github.com/UMEP-dev/UMEP
UMEP journal reference: Lindberg, F., Grimmond, C.S.B., Gabey, A., Huang, B., Kent, C.W., Sun, T., Theeuwes, N.E., Järvi, L., Ward, H.C., Capel-Timms, I. and Chang, Y., 2018. Urban Multi-scale Environmental Predictor (UMEP): An integrated tool for city-based climate services. Environmental Modelling & Software, 99, pp.70-87. https://doi.org/10.1016/j.envsoft.2017.09.020
For detailed documentation, see Solweig-GPU Documentation
- CPU and GPU support (automatically uses GPU if available)
- Divides larger areas into tiles based on the selected tile size
- CPU-based computations of wall height and aspect are parallelized across multiple CPUs
- GPU-based computation of SVF, shortwave/longwave radiation, shadows, Tmrt, and UTCI
- Compatible with meteorological data from UMEP, ERA5, and WRF (
wrfout)
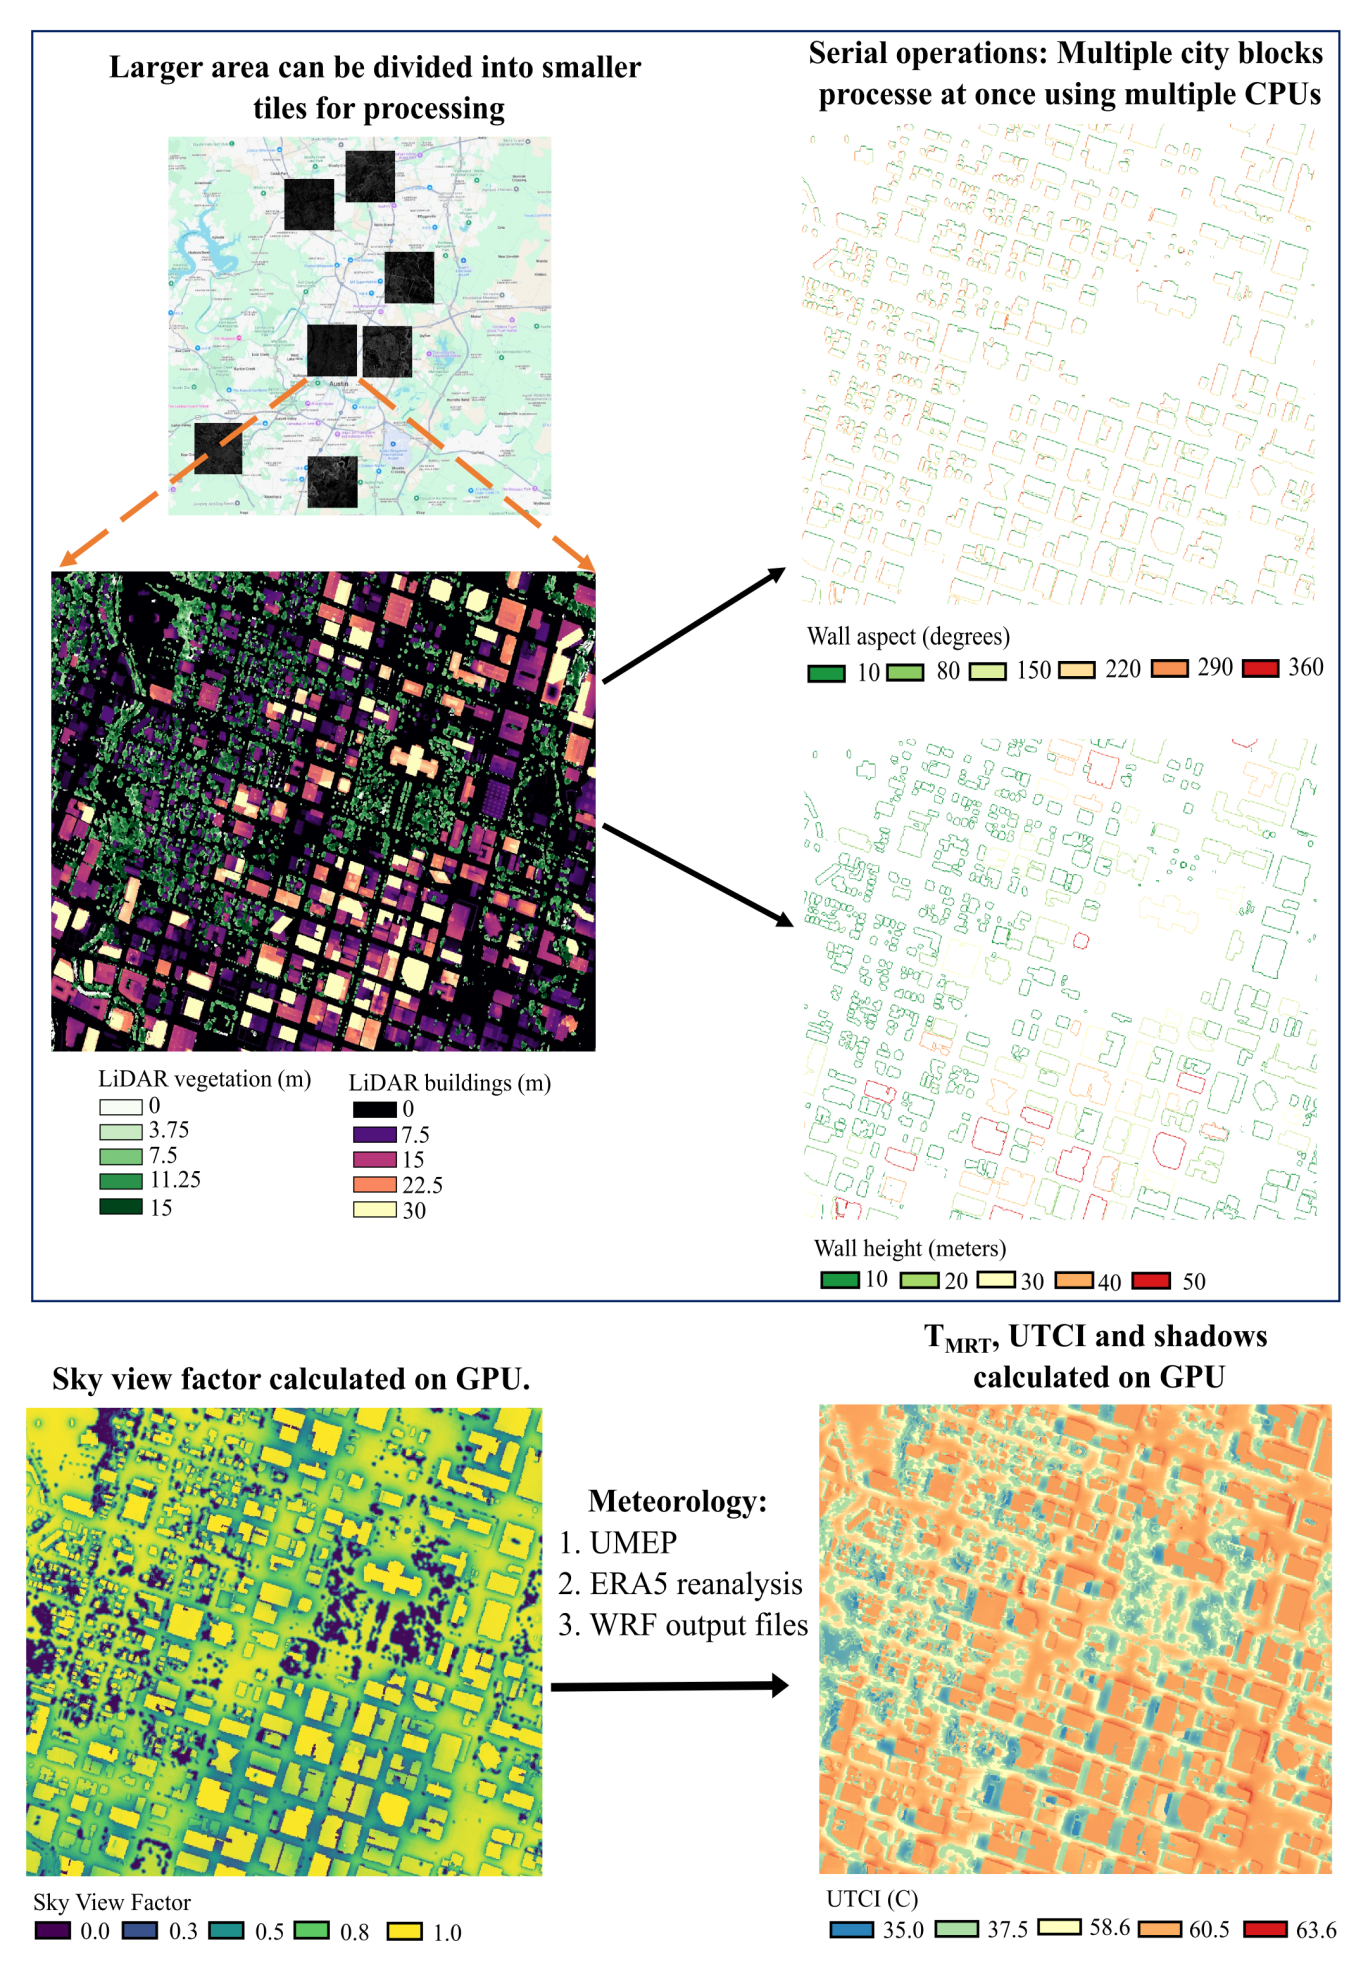
Flowchart of the SOLWEIG-GPU modeling framework
Building DSM: Includes both buildings and terrain elevation (e.g.,Building_DSM.tif)DEM: Digital Elevation Model excluding buildings (e.g.,DEM.tif)Tree DSM: Vegetation height data only (e.g.,Trees.tif)
- Meteorological forcing:
- Custom
.txtfile (from UMEP) - ERA5 (both instantaneous and accumulated)
- WRF output NetCDF (
wrfout)
- Custom
- 2-meter air temperature
- 2-meter dew point temperature
- Surface pressure
- 10-meter U and V wind components
- Downwelling shortwave radiation (accumulated)
- Downwelling longwave radiation (accumulated)
- Output directory:
Outputs/ - Structure: One folder per tile (e.g.,
tile_0_0/,tile_0_600/) - SVF: Single-band raster
- Other outputs: Multi-band raster (e.g., 24 bands for hourly results)
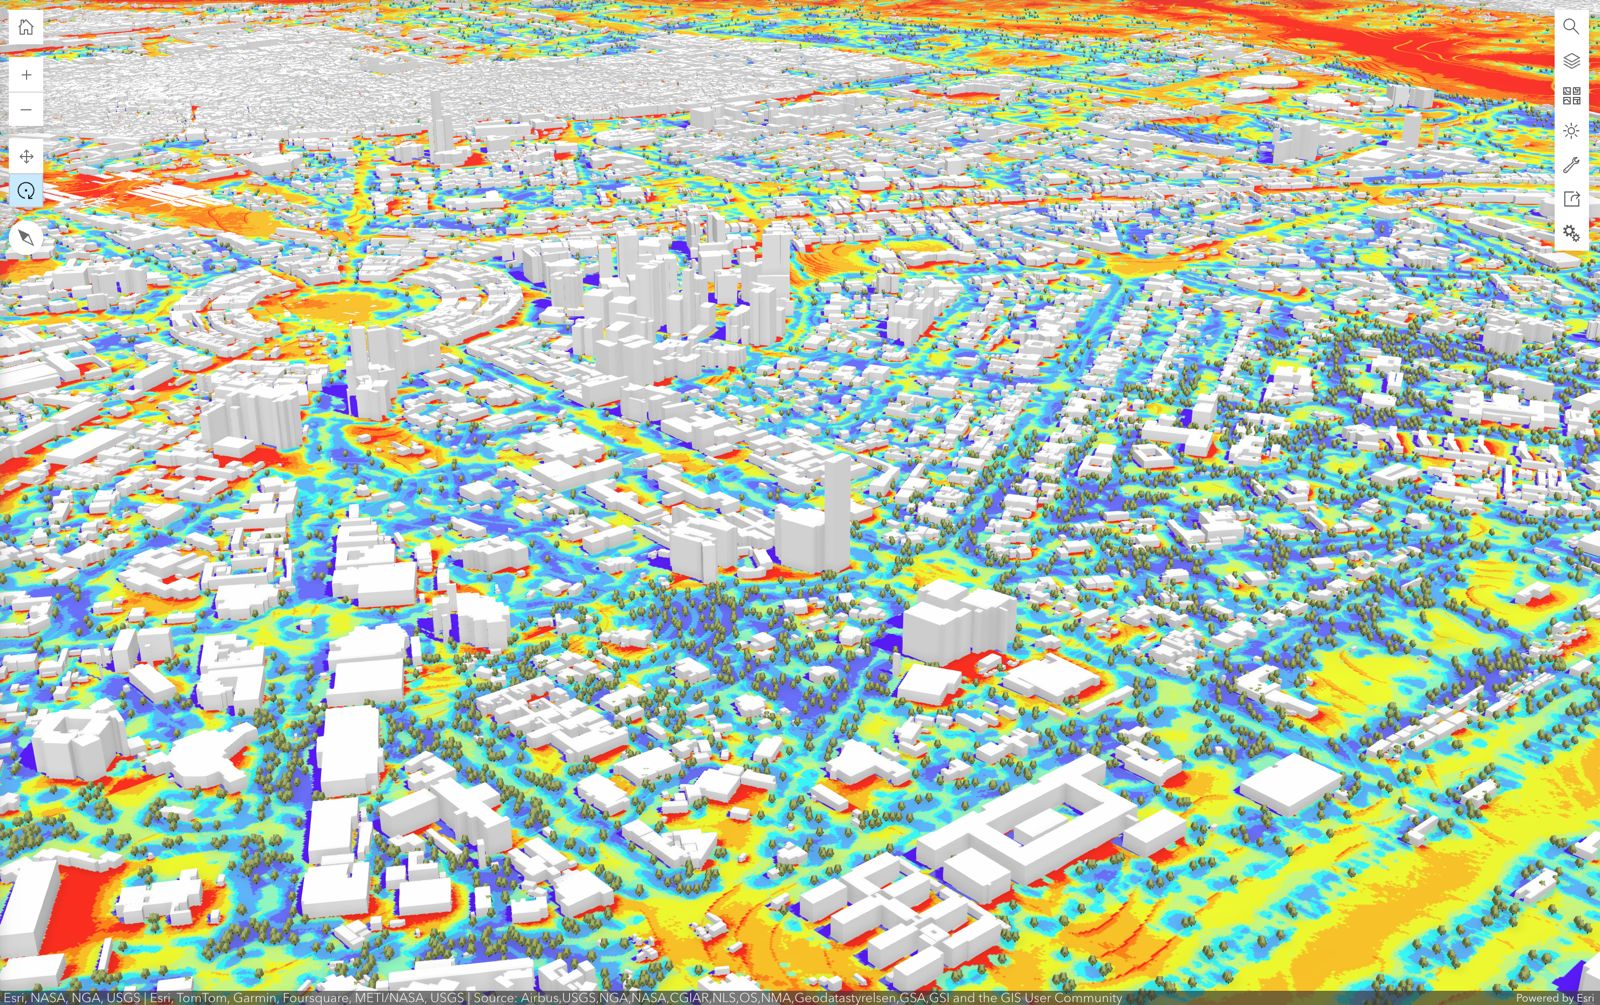
UTCI for New Delhi, India, generated using SOLWEIG-GPU and visualized with ArcGIS Online.
conda create -n solweig python=3.10
conda activate solweig
conda install -c conda-forge gdal cudnn pytorch timezonefinder matplotlib sip #cudnn is required only if you are using nvidia GPU
pip install PyQt5
pip install solweig-gpu
Run the test suite with:
pytest -qWith coverage:
pytest --cov=solweig_gpu --cov-report=term-missingCI runs tests on Linux and macOS across Python 3.10–3.12.
Please refer to the sample dataset to familiarize yourself with the expected inputs. Sample data can be found at:
-
The
Input_rasterfolder in the sample contains the raster files required by SOLWEIG-GPU:Building_DSM.tifDEM.tifTrees.tifLandcover.tif(optional)
-
SOLWEIG-GPU can be meteorologically forced in three ways:
- Using your own meteorological
.txtfile - ERA5 reanalysis
- Weather Research and Forecasting (WRF) output files. Make sure filenames follow one of:
wrfout_d0x_yyyy-mm-dd_hh_mm_ss(preferred; works across operating systems)wrfout_d0x_yyyy-mm-dd_hh:mm:sswrfout_d0x_yyyy-mm-dd_hh
- Using your own meteorological
-
The
Forcing_datafolder in the sample data contains example data for all forcing methods.
from solweig_gpu import thermal_comfort

thermal_comfort(
    base_path='/path/to/input',
    selected_date_str='2020-08-13',
    building_dsm_filename='Building_DSM.tif',
    dem_filename='DEM.tif',
    trees_filename='Trees.tif',
    landcover_filename=None,
    tile_size=1000,
    overlap=100,
    use_own_met=False,
    own_met_file='/path/to/met.txt',  # Placeholder as use_own_met=False
    start_time='2020-08-13 06:00:00',
    end_time='2020-08-14 05:00:00',
    data_source_type='wrfout',
    data_folder='/path/to/era5_or_wrfout',
    save_tmrt=False,  # True if you want to save TMRT, likewise below, default True
    save_svf=False,
    save_kup=False,
    save_kdown=False,
    save_lup=False,
    save_ldown=False,
    save_shadow=False
)- The model simulation date is
2020-08-13 - The start and end dates provided to the model are
2020-08-13 06:00:00 UTCand2020-08-14 05:00:00 UTC, respectively. These are start and end time of wrfout in UTC. In local time it is2020-08-13 01:00:00to2020-08-13 23:00:00(Austin, TX). UTC to local time conversion will be done internally. - The tile_size depends on the RAM of the GPU but can be set to 1000 in the example.
- overlap is set to 100 pixels meaning the raster size will be 1100*1100 pixels. The additional 100 pixels are for shadow transfer between the tiles.
from solweig_gpu import thermal_comfort

thermal_comfort(
    base_path='/path/to/input',
    selected_date_str='2020-08-13',
    building_dsm_filename='Building_DSM.tif',
    dem_filename='DEM.tif',
    trees_filename='Trees.tif',
    landcover_filename = None,
    tile_size =1000,
    overlap = 100,
    use_own_met=False,
    own_met_file='/path/to/met.txt',  #Placeholder as use_own_met=False
    start_time='2020-08-13 06:00:00',
    end_time=  '2020-08-13 23:00:00',
    data_source_type='ERA5',
    data_folder='/path/to/era5_or_wrfout',
    save_tmrt=False, #True if you want to save TMRT, likewise below
    save_svf=False,
    save_kup=False,
    save_kdown=False,
    save_lup=False,
    save_ldown=False,
    save_shadow=False
)- For the ERA-5, the sample data provided is from
2020-08-13 06:00:00 UTCto2020-08-13 23:00:00 UTC. So the simulation will run from2020-08-13 01:00:00to2020-08-13 18:00:00local time (Austin, TX) - Ony when ERA-5 data is used, the model can set the datetime automatically. For example, if the ERA-5 data are from
2020-08-13 00:00:00 UTCto2020-08-14 23:00:00 UTCand the selected simulation date is2020-08-13along with start time of2020-08-13 06:00:00 UTCand end time of2020-08-14 05:00:00 UTC, the model will automatically process the data for the selected datetime provided there are ERA-5 data for those datetimes.
from solweig_gpu import thermal_comfort
thermal_comfort(
    base_path='/path/to/input',
    selected_date_str='2020-08-13',
    building_dsm_filename='Building_DSM.tif',
    dem_filename='DEM.tif',
    trees_filename='Trees.tif',
    landcover_filename = None,
    tile_size =1000,
    overlap = 100,
    use_own_met= True,
    own_met_file='/path/to/met.txt',
    start_time='2020-08-13 06:00:00', # Placeholder
    end_time=  '2020-08-13 23:00:00', # Placeholder
    data_source_type='ERA5', # Placeholder
    data_folder='/path/to/era5_or_wrfout', # Placeholder
    save_tmrt=False, #True if you want to save TMRT, likewise below
    save_svf=False,
    save_kup=False,
    save_kdown=False,
    save_lup=False,
    save_ldown=False,
    save_shadow=False
)conda activate solweig
thermal_comfort --base_path '/path/to/input' ^
--date '2020-08-13' ^
--building_dsm 'Building_DSM.tif' ^
--dem 'DEM.tif' ^
--trees 'Trees.tif' ^
--tile_size 1000 ^
--landcover 'Landcover2.tif' ^
--overlap 100 ^
--use_own_met False ^
--data_source_type 'ERA5' ^
--data_folder '/path/to/era5' ^
--start '2020-08-13 06:00:00' ^
--end '2020-08-13 23:00:00' ^
--save_tmrt True ^
--save_svf False ^
--save_kup False ^
--save_kdown False ^
--save_lup False ^
--save_ldown False ^
--save_shadow FalseTip: Use
--helpto list all CLI options.
To launch the GUI:
conda activate solweig
solweig_gpu_gui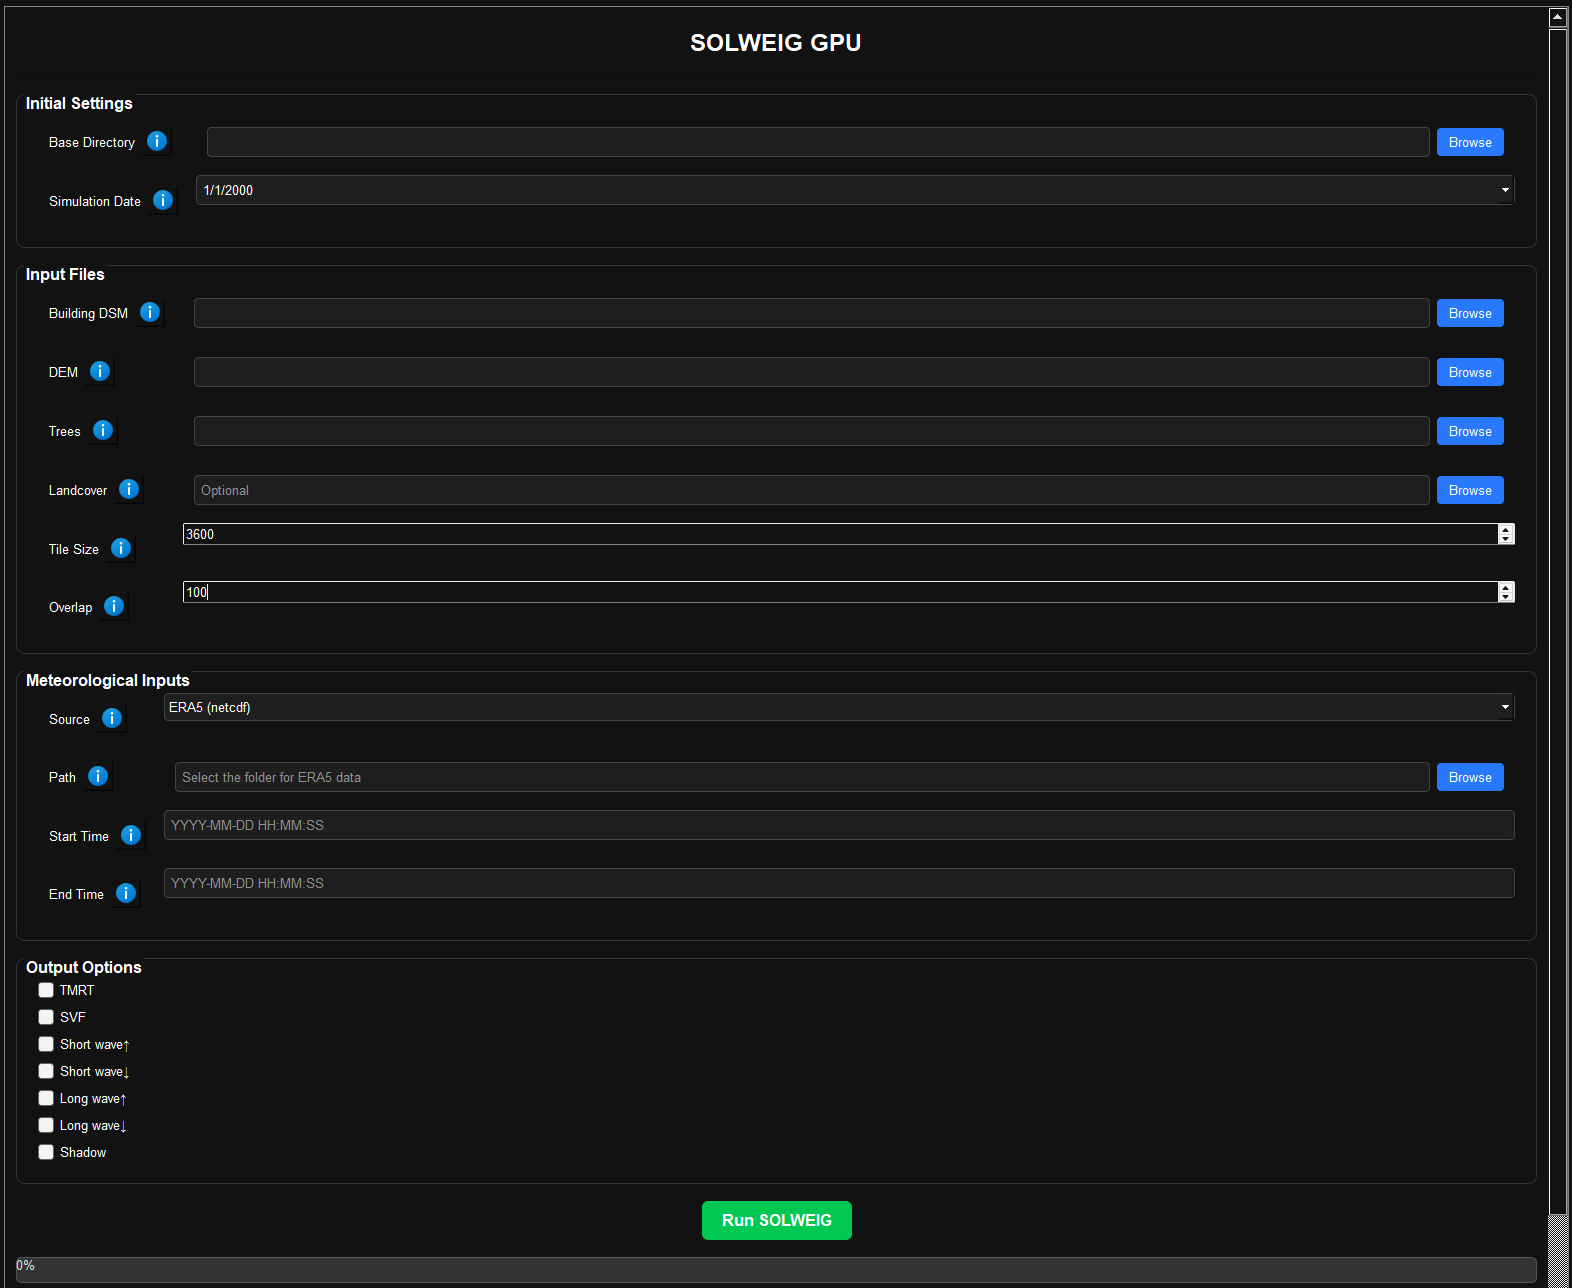
- Select the base path containing input datasets.
- Choose the Building DSM, DEM, Tree DSM, and Land cover (optional) raster files.
- Set the tile size (e.g., 600 or 1200 pixels).
- Select a meteorological source (
metfile,ERA5, orwrfout):- If
metfile: Provide a.txtfile. - If
ERA5: Provide a folder with both instantaneous and accumulated files. - If
wrfout: Provide a folder with WRF output NetCDF files.
- If
- Set the start and end times in UTC (
YYYY-MM-DD HH:MM:SS). - Choose which outputs to generate (e.g., Tmrt, UTCI, radiation fluxes).
- Output will be saved in
Outputs/, with subfolders for each tile.
Please refer to the documentation