
![]()

 example PDF report here: PDF REPORT
The CPAC-qc Plotting App is a tool designed to generate quality control plots for the CPAC (Configurable Pipeline for the Analysis of Connectomes) outputs. This app helps in visualizing and assessing the quality of neuroimaging data processed through CPAC.
- Outputs only PDF report now.
- Default config has overlays.
- Images on PDF report will follow the order mentioned in overlay.csv provided or default.
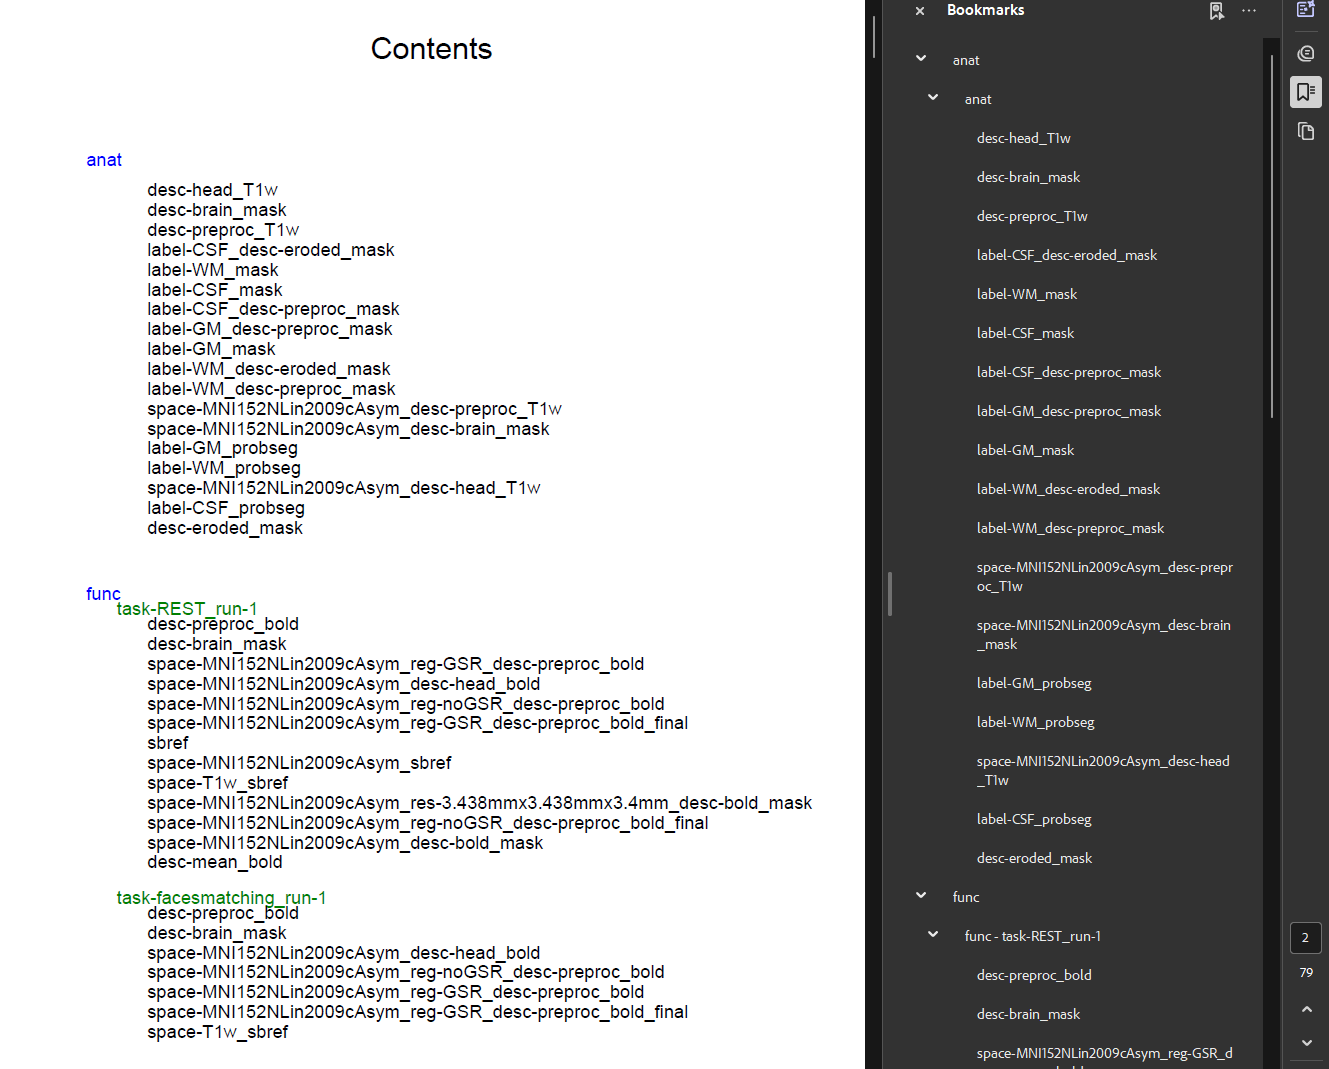
- Added Bookmarks on PDF report for easy navigation.
- Generate bulk or subject specific plots and reports.
- BIDS dir with
.nii.gzimages in it. - PDF viewer
pip install CPACqc- Minimal code
cpacqc -d bids_dirThis will output a pdf report report.pdf in your current directory.
- Providing output dir
cpacqc -d bids_dir -o output_diroutput_dir will be created if not available. Make sure to have write permissions.
- Running single/multiple Subjects
cpacqc -d bids_dir -s subject-id_1 subject-id_2You can hand pick a single or a multiple subjects with -s flag
- With defined number of procs
cpacqc -d bids_dir -n number-of-procsNote: if -n is not provided default is 8
- Providing custom Overlays config
cpacqc -d path/to/bids_dir -c ./overlay.csvwhere overlay.csv can be in format
output,underlay,datatype
desc-preproc_bold,desc-preproc_T1w,func
and so on. If not provided a default config will be used.
Use any PDF viewer to view *report.pdf file.
If -html enabled, Use any .html viewer extension to view index.html in the results dir.